Engineering, Management, Technology Consulting

  • Take a look inside Google’s high-tech data centers.

  • I was reading the following article about the Engineering Slide Charts and realized that it was now available as an App for my phone.

    Engineering Slide Chart in Play

    great-innovations-ultimate-engineering-screw-chart-front-detail

    The slide rule may be a quaint anachronism in this age of ubiquitous computing, but there’s still a place for the slide chart, the volvelle, the nomogram, and other hand-held “paper computers.” These are still published by a few companies, and are a handy source of on-the-spot reference data, particularly in field or workshop environments that may be inhospitable to or inconvenient for electronic devices or books. Slide charts containing key screw, bolt, and nut data have been around for decades, and the folks at Great Innovations identify TAD’s Universal Reference Calculator, discontinued in the mid 1990s, as inspiration for their chart.

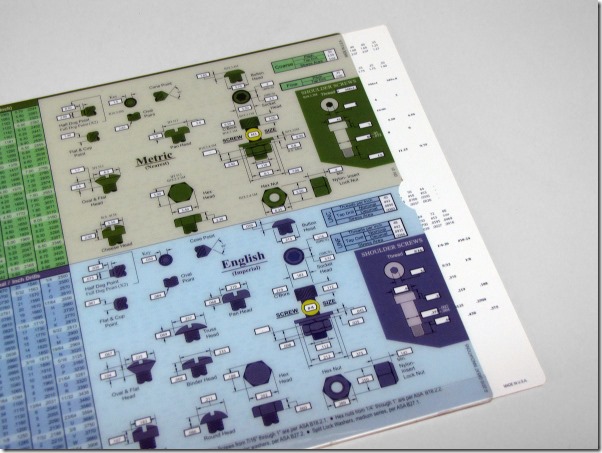
    The thing itself is simple enough: a clear plastic outer sleeve printed with dimensional drawings and callout fields on both sides, and an opaque plastic inner card printed with the callout data. Sliding the card back and forth in the sleeve indexes all the callout data simultaneously, and of course can be used bidirectionally—you can get key dimensional data from a known fastener size, or figure out fastener size from some real measured dimension. Overall, the chart is about 1/16″ thick, flexible, and measures 8.75″ × 11″—about the same size as a standard sheet of printer paper.

     engineering-screw-chart-front

    The front includes sliding tap, drill and stress area callouts for SAE and metric screws, in both standard and coarse threads, as well as key dimensions—such as countersink depth, counterbore depth, socket cap size, etc.—for various types of screw heads, points and nuts. Detail boxes cover metric and SAE shoulder bolt dimensions. The areas not occupied by the sliding chart fields are filled up with static tabulated data—metric/SAE drill equivalent diameters, fractional/decimal drill diameters, common unit conversions, metric prefixes, and SAE bolt grade markings.

    engineering-screw-chart-back 

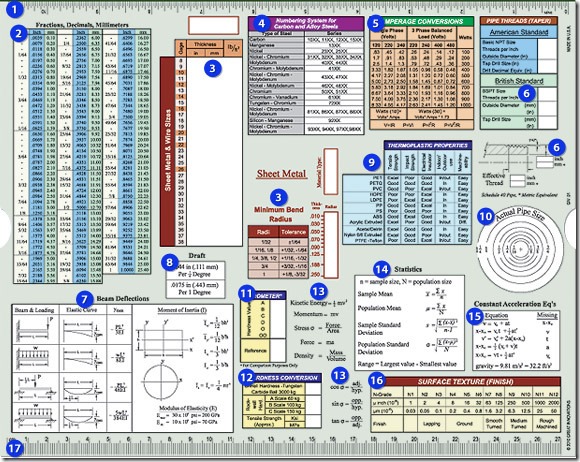
    The back has sliding indices for sheet metal and wire gages, dimensioned thicknesses, densities, and minimum bend radii; critical dimensions for tapered pipe threads both NPT and BSPT; and a hardness converter for Shore durometers A-OO with typical reference materials (e.g. “Shopping Cart Wheel”) and conversion factors for Brinell and Rockwell A-C hardnesses, as well as approximate tensile strengths. Static tabulated references include the numbering system for carbon and alloy steels, a circular actual-to-nominal pipe size gauge, and a slew of handy equations from statics, dynamics, electrical engineering, and statistics. One of the long edges is printed with an English ruler, and the other with a metric rule. No space is wasted; pulling out the sliding inner card reveals three more handy tables printed in the “dead spaces” between the keyholes—densities of common metals, a key to common mechanical drafting symbols, and a key to AWS standard weld symbols.

    I use the chart in my workshop quite often—mostly, so far, to look up tap drill sizes and gauge nominal pipe diameters. It’s compact and durable and water- and grease-proof, and has saved me a lot of time running back and forth between my web-connected smartphone, tablet, laptop, or whatever (all of which I like to keep clean) and my dirty workshop and tools. Mine is a review unit I got for free, and I would recommend it enthusiastically to others if not for the price of $24.99, which is about $10 more than I think I would pay for the thing. A functionally-equivalent app is available for both iOS and Android for $5 less, but in my mind that sort of defeats the purpose, which is that you can keep the chart on-hand in an environment that might not be hospitable for a handheld electronic device, and don’t have to worry about keeping it clean, charged, or safe from damage.

    Engineering Slide Charts

  • feng-shui-tips-infographic-small_thumb.jpg

  • From The Washington Post:

    In the latest issue of the European Journal of Physics, Franco Bocci ponders (pdf) one of life’s enduring mysteries. If you’re caught in the rain without an umbrella, is it better to run or walk in order to stay as dry as possible?

    This is also a sensible strategy. (Ricky Carioti/The Washington Post)

    Running seems entirely sensible—you can get to dry shelter quicker. But you also hit more raindrops by running. So there’s a genuine trade-off. Bocci used math to explore the problem more thoroughly and found that running isusually better, although it really depends on the situation:

    The problem of choosing an optimal strategy for moving in the rain has attracted considerable attention among physicists and other scientists. Taking a novel approach, this paper shows, by studying simple shaped bodies, that the answer depends on the shape and orientation of the moving body and on wind direction and intensity. For different body shapes, the best strategy may be different: in some cases, it is best to run as fast as possible, while in some others there is an optimal speed.

    Basically, the best strategy for staying dry (or at least somewhat dry) is to run as fast as possible. Unless you’re really thin, in which case there may be a more optimal speed. And if you’ve got a tailwind behind you, then you should run exactly as fast as the wind at your back.

    This sounds like a weird, random topic, but the BBC’s Jason Palmer reports that the raindrop problem has famously vexed physicists and mathematicians for decades:

    The battleground for this bit of hobby mathematics now seems to be the UK’s Institute of Physics publication the European Journal of Physics. In 1987, another Italian researcher asserted in the journal that changing strategies did not make a substantial difference. In 2011, a textile expert and a physicist used the same publication to suggest that an optimal speed existed, depending on the wind direction….

    What complicates the question is the human shape; for simplicity, previous attempts to crack the thorny problem assumed people to be thin sheets or upright, rectangular boxes.

    When Prof Bocci considered a more general case–likely to be the case you would face in the rain–he found that the answer may depend on an individual’s height-to-breadth ratio as well as wind direction and raindrop size.

    See this 2005 piece by mathematician Nick Allen for a look at some of the equations involved. Bocci’s paper is the latest salvo, offering up a new twist on the problem, though the debate may well continue. But next time it starts pouring all of the sudden and you decide to make a dash for it, running at the exact same speed as the wind at your back, be assured that you have cutting-edge physics on your side.